

Significant wave height: 16.1 feet
Gust: 52.6 kts
images: NOAA - graphs of wind gusts and wave steepness at Ambrose Light data buoy. click on icons below for more graphs of the March 13 storm
images: NOAA - graphs of wind gusts and wave steepness at Ambrose Light data buoy. click on icons below for more graphs of the March 13 storm
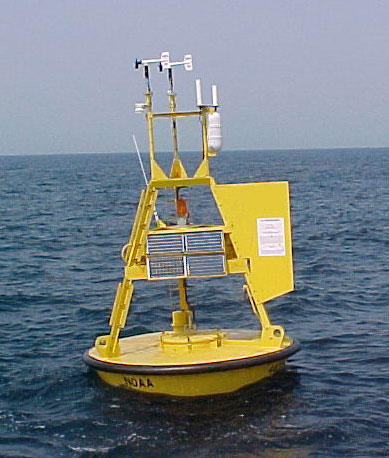
Station 44065 (LLNR 725) - Entrance to New York Harbor | ||||||||||||||||||||||||||||||||||||||||||||||||||||||||||||||||||||||||||||||||||||||||||||||||||||||||||||||||||||||||||||||||||||||||||||||||||||||||||||||||||||||||||||||||||||||||||||||||||||||||||||||||||||||||||||||||||||||||||||||||||||||||||||||||||||||||||||||||||||||||||||||||||||||||||||||||||||||||||||||||||||||||||||||||||||||||||||||||||||||||||||||||||||||||||||||||||||||||||||||||||||||||||||||||||||||||||||||||||||||||||||||||||||||||||||||||||||||||||||||||||||||||||||||||||||||||||||||||||||||||||||||||||||||||||||||||||||||||||||||||||||||||||||||||||||||||
Owned and maintained by National Data Buoy Center 3-meter discus buoy ARES payload 40.369 N 73.703 W (40°22'10" N 73°42'10" W) Site elevation: sea level Air temp height: 4 m above site elevation Anemometer height: 5 m above site elevation Barometer elevation: sea level Sea temp depth: 0.6 m below site elevation Water depth: 50 m Watch circle radius: 90 yards Right whales are active off NY. Speed restrictions of 10 knots apply to vessels 65 feet or greater in specific areas along the mid-Atlantic coast. To learn more about right whales and rules protecting them, go to: http://nmfs.noaa.gov/pr/shipstrike The QuikSCAT wind data are no longer available. |


Click on the graph icon in the table below to see a time series plot of the last five days of that observation. | ||
 | Wind Direction (WDIR): | ENE ( 60 deg true ) |
| Wind Speed (WSPD): | 17.5 kts |
| Wind Gust (GST): | 25.3 kts |
| Wave Height (WVHT): | 15.7 ft |
| Dominant Wave Period (DPD): | 12 sec |
| Average Period (APD): | 7.7 sec |
| Mean Wave Direction (MWD): | SE ( 138 deg true ) |
| Atmospheric Pressure (PRES): | 29.40 in |
| Pressure Tendency (PTDY): | -0.02 in ( Falling ) |
| Air Temperature (ATMP): | 43.5 °F |
| Water Temperature (WTMP): | 39.6 °F |
| Dew Point (DEWP): | 42.8 °F |
| Wind Chill (CHILL): | 35.1 °F |
| Combined plot of Wind Speed, Gust, and Air Pressure | |
| |||||||||||||||||||||||
|
| | | | | | | | | | | | | | | ||||
| MM | DD | TIME (EST) | WDIR | WSPD kts | GST kts | WVHT ft | DPD sec | APD sec | MWD | PRES in | PTDY in | ATMP °F | WTMP °F | DEWP °F | SAL psu | VIS nmi | TIDE ft | |
|---|---|---|---|---|---|---|---|---|---|---|---|---|---|---|---|---|---|---|
| 03 | 13 | 11:50 pm | ENE | 25.3 | 35.0 | 15.7 | 10 | 7.5 | SE | 29.40 | -0.03 | 44.1 | 39.7 | 42.6 | - | - | - | |
| 03 | 13 | 10:50 pm | ENE | 31.1 | 36.9 | 16.7 | 10 | 7.7 | SE | 29.39 | -0.03 | 43.5 | 39.9 | 42.4 | - | - | - | |
| 03 | 13 | 9:50 pm | E | 33.0 | 38.9 | 17.7 | 10 | 8.0 | SE | 29.41 | +0.00 | 44.1 | 39.9 | 43.2 | - | - | - | |
| 03 | 13 | 8:50 pm | E | 35.0 | 40.8 | - | - | - | - | 29.43 | +0.02 | 44.4 | 39.7 | 43.3 | - | - | - | |
| 03 | 13 | 7:50 pm | E | 35.0 | 46.6 | 19.4 | 11 | 8.1 | SE | 29.42 | +0.01 | 44.8 | 39.7 | 43.3 | - | - | - | |
| 03 | 13 | 6:50 pm | E | 35.0 | 46.6 | 19.4 | 10 | 7.9 | SE | 29.41 | -0.03 | 45.3 | 39.9 | 44.1 | - | - | - | |
| 03 | 13 | 5:50 pm | E | 36.9 | 46.6 | 16.7 | 11 | 7.5 | SSE | 29.41 | -0.05 | 45.1 | 39.9 | 44.1 | - | - | - | |
| 03 | 13 | 4:50 pm | E | 38.9 | 52.4 | - | - | - | - | 29.41 | -0.12 | 45.1 | 39.9 | 44.1 | - | - | - | |
| 03 | 13 | 3:50 pm | ENE | 38.9 | 48.6 | 16.1 | 9 | 7.0 | SE | 29.44 | -0.19 | 44.4 | 40.1 | 43.7 | - | - | - | |
| 03 | 13 | 2:50 pm | ENE | 38.9 | 48.6 | - | - | - | - | 29.45 | -0.19 | 44.1 | 40.1 | 42.4 | - | - | - | |
| 03 | 13 | 1:50 pm | ENE | 36.9 | 48.6 | - | - | - | - | 29.53 | -0.15 | 43.7 | 40.1 | 43.2 | - | - | - | |
| 03 | 13 | 12:50 pm | ENE | 29.1 | 36.9 | 14.4 | 11 | 7.3 | SSE | 29.63 | -0.07 | 44.1 | 40.1 | 43.2 | - | - | - | |
| 03 | 13 | 11:50 am | E | 33.0 | 42.7 | - | - | - | - | 29.64 | -0.10 | 43.7 | 40.1 | 43.0 | - | - | - | |
| 03 | 13 | 10:50 am | E | 33.0 | 42.7 | - | - | - | - | 29.68 | -0.07 | 44.1 | 40.1 | 43.0 | - | - | - | |
| 03 | 13 | 9:50 am | E | 35.0 | 44.7 | 13.1 | 8 | 6.6 | SE | 29.70 | -0.06 | 43.3 | 40.1 | 42.1 | - | - | - | |
| 03 | 13 | 8:50 am | ENE | 31.1 | 38.9 | - | - | - | - | 29.74 | -0.06 | 42.6 | 39.9 | 41.5 | - | - | - | |
| 03 | 13 | 7:50 am | ENE | 33.0 | 38.9 | - | - | - | - | 29.75 | -0.06 | 41.7 | 39.9 | 39.6 | - | - | - | |
| 03 | 13 | 6:50 am | ENE | 33.0 | 42.7 | 10.8 | 8 | 6.0 | ESE | 29.77 | -0.05 | 41.5 | 39.9 | 40.3 | - | - | - | |
| 03 | 13 | 5:50 am | E | 31.1 | 38.9 | - | - | - | - | 29.80 | -0.05 | 41.5 | 39.9 | 40.3 | - | - | - | |
| 03 | 13 | 4:50 am | ENE | 31.1 | 38.9 | - | - | - | - | 29.82 | -0.07 | 41.0 | 39.7 | 39.9 | - | - | - | |
| 03 | 13 | 3:50 am | ENE | 31.1 | 38.9 | - | - | - | - | 29.82 | -0.10 | 40.8 | 39.7 | 39.7 | - | - | - | |
| 03 | 13 | 2:50 am | ENE | 31.1 | 36.9 | 10.8 | 8 | 5.9 | ESE | 29.85 | -0.08 | 41.2 | 39.7 | 40.1 | - | - | - | |
| 03 | 13 | 1:50 am | ENE | 29.1 | 33.0 | - | - | - | - | 29.89 | -0.05 | 40.6 | 39.7 | 38.5 | - | - | - |
Click on the graph icon in the table below to see a time series plot of the last five days of that observation. | ||
| Significant Wave Height (WVHT): | 15.7 ft |
| Swell Height (SwH): | 12.5 ft |
| Swell Period (SwP): | 12.1 sec |
| Swell Direction (SwD): | SE |
| Wind Wave Height (WWH): | 9.5 ft |
| Wind Wave Period (WWP): | 7.7 sec |
| Wind Wave Direction (WWD): | ESE |
| Wave Steepness (STEEPNESS): | AVERAGE |
| Average Wave Period (APD): | 7.7 sec |


No comments:
Post a Comment